

서비스
인간 전엑솜 시퀀싱 (hWES)
전장 엑솜 시퀀싱 (Whole Exome Sequencing) 은 차세대 시퀀싱 기술 (Next-Generation Sequencing, NGS) 을 활용하여 전장 유전체 시퀀싱 (Whole Genome Sequencing, WGS) 에 비해 비용 효율적인 대안을 제공합니다.
인간 전장 엑솜 (human whole exome) 은 약 18만 개의 엑손 (exon, 단백질 코딩 영역) 으로 구성되어 있으며, 전체 인간 유전체의 1~2% 에 불과하지만, 멘델 유전 질환 (Mendelian disorders) 과 관련된 변이의 최대 85%가 이 영역에서 발생합니다 1.
이러한 영역을 표적으로 삼아 인간 전장 엑솜 시퀀싱 (hWES) 은 유전체 변이 (genome variants), 생식세포 변이 (germline mutations), 체세포 변이 (somatic mutations), 병리학적 기전 (pathogenic mechanisms) 을 심층적으로 분석할 수 있는 시퀀싱 및 해석 방법을 제공합니다.
hWES 서비스는 유전 질환 관련 변이(genetic disease-related variants), 복합 질환 (complex diseases), 암 연구 (cancer research), 인간 집단 유전학 (human population genetics) 등 다양한 연구분야를 지원합니다.

응용 분야 (Applications)
인간 전장 엑솜 시퀀싱 (human whole exome sequencing) 은 다양한 최첨단 연구 및 임상 질문에 대한 해답을 찾는 데 효과적으로 활용되고 있습니다.
- 엑손 검출을 통한 유전체 변이 연구(Genome variant studies through exon detection).
- 연구 및 임상 환경에서 샘플의 병리학적 기전(Pathogenic mechanism) 및 분자적 특성 분석(Molecular characterization).
- 암 생검(Cancer biopsy) 도구로의 활용.
노보진 서비스의 장점 및 특징
- 다양한 WES 패널 선택 가능: Novogene은 인간 전장 엑솜 시퀀싱(WES)에 대한 풍부한 경험을 보유하고 있으며, IDT, Twist, Agilent 등 다양한 상업용 벤더의 WES 패널을 활용한 프로젝트를 지원합니다. 특히, Twist WES 데이터에는 완전한 mtDNA 패널이 포함되어 있어 미토콘드리아 변이에 대한 중요한 인사이트를 제공합니다.
- 포괄적인 바이오인포매틱스 지원: SNV, InDel, CNV 분석을 포함한 엔드투엔드(End-to-End) 바이오인포매틱스 지원을 제공하며, 사용자가 원하는 데이터베이스를 기반으로 논문 게재용 분석 결과를 제공합니다.
- 멀티 플랫폼 지원: Novogene은 최신 시퀀싱 플랫폼을 활용하여, 숏리드(Short-Read) 및 롱리드(Long-Read) 시퀀싱 전략 중 원하는 방식을 선택할 수 있도록 유연한 솔루션을 제공합니다.
사양: DNA 샘플 요구사항
Platform Type | Sample Type | Amount (Qubit®) | Purity |
Illumina NovaSeq System | Genomic DNA | ≥ 300 ng ≥ 300 ng | A260/280 = 1.8-2.0; no degradation, no contamination |
cfDNA/ctDNA | ≥ 30 ng | Fragments should be in multiples of 170 bp, with no genomic contamination | |
Genomic DNA from FFPE tissue | ≥ 400 ng | Fragments should be ≥ 1000 bp |
사양: 시퀀싱 및 분석
Sequencing Platform | Illumina NovaSeq System |
Read Length | Paired-end 150 bp |
Sequencing Depth | For Mendelian disorder/rare disease: effective sequencing depth above 50× (6G) |
For tumor sample: effective sequencing depth above 100× (12G) | |
Data Analysis |
• Data quality control |
프로젝트 진행 과정
노보진은 프로젝트의 모든 과정에서 최고 수준의 품질과 전문적인 서비스를 제공하여 연구자들이 신뢰할 수 있는 결과를 얻을 수 있도록 지원합니다. 모든 단계는 엄격한 과학적 기준에 따라 설계되고 수행되며, 시퀀싱 데이터의 정확성과 신뢰성을 보장하기 위해 철저한 품질 관리(QC) 절차가 적용됩니다.
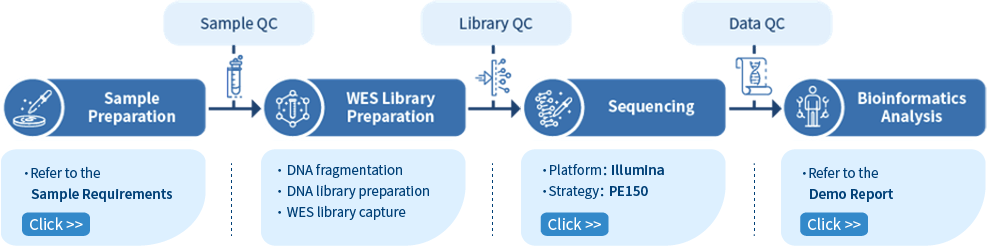
전체 워크플로우는 샘플 준비 및 정량화, DNA 절단 및 라이브러리 제작, 라이브러리 품질 검증, 시퀀싱, 생물정보 분석 등의 주요 단계로 이루어져 있습니다.
[1]https://www.nature.com/articles/jhg2013114
인간 전장 엑솜 시퀀싱(Human Whole Exome Sequencing) 관련 논문
인간 전장 엑솜 시퀀싱 (Human Whole Exome Sequencing, hWES) 은 희귀 멘델 유전 질환 (rare Mendelian disorders), 복합 질환 (complex diseases), 암 (cancer), 및 인간 집단 연구 (human population studies) 에서 단백질 코딩 변이 (protein-coding variants) 를 비용 효율적으로 분석할 수 있도록 지원합니다.
여기에서는 Novogene hWES 서비스를 활용한 주요 학술 논문 (outstanding academic publications) 을 요약하여 소개합니다.
Novogene hWES 서비스를 활용한 주요 학술 논문을 소개합니다.
Data Quality Control
시퀀싱 오류율 (sequencing error rate) 은 딥 시퀀싱 (deep sequencing) 을 통해 저빈도 변이 (low-frequency variations) 를 정확하게 검출하는 데 있어 주요 혼란 요인 (confounding factor) 입니다. 이는 시퀀싱 데이터의 품질을 결정하는 핵심 요소입니다.
시퀀싱 오류율은 시퀀싱 사이클(sequencing cycle)과 밀접하게 연관되며, 시약(chemical reagents)의 소모로 인해 리드(read)의 끝부분에서 점차 증가하는 경향이 있습니다. 이는 Illumina 고처리량 시퀀싱(high-throughput sequencing) 플랫폼에서 일반적으로 나타나는 특징입니다.

참고: x축은 **리드 내 위치(position in reads)**를 나타내며, y축은 **해당 위치에서 모든 리드의 평균 염기 오류율(average error rate of bases of all reads)**을 나타냅니다.
GC 함량 분포(GC content distribution)는 AT/GC 분리 가능성을 평가하는 데 사용됩니다. 샘플 오염(sample contamination), 시퀀싱 바이어스(sequencing bias), 그리고 라이브러리 준비(library preparation) 과정에서 발생하는 오류는 시퀀싱 결과에 영향을 줄 수 있습니다.

참고: x축은 리드 내 위치 (position in reads) 를 나타내며, y축은 각 염기 유형 (A, T, G, C) 의 비율 (percentage of each type of bases) 을 나타냅니다. 서로 다른 염기는 각각 다른 색상으로 구분됩니다.
Alignment to Reference Genome
시퀀싱 깊이 (sequencing depth) 와 커버리지 (coverage) 는 이미 알려진 참조 뉴클레오타이드 (reference nucleotides)에 정렬된 페어엔드 (pair-end) 클린 리드 (clean reads) 의 평균 개수를 나타냅니다.
시퀀싱 커버리지 분포(sequencing coverage distribution)는 특정 염기 위치에서 변이(Variations)를 신뢰성 있게 식별할 수 있는지를 결정하는 중요한 요소입니다.

Figure 3: Average sequencing depth (bar plot) and coverage (dot-line plot) in each chromosome
단일 염기 다형성 (Single Nucleotide Polymorphisms, SNPs) 또는 단일 염기 변이 (Single Nucleotide Variants, SNVs) 는 유전체에서 가장 큰 비율을 차지하는 유전 변이 (genetic variants) 유형입니다. 또 다른 유전 변이 유형으로는 작은 삽입 및 결실 (Small Insertions and Deletions, InDels) 이 있으며, 이들은 길이가 50bp 미만입니다. 코딩 영역 (coding region) 또는 스플라이싱 부위 (splicing sites) 에 존재하는 InDels은 mRNA 전사체 (mRNA transcripts) 및 단백질 (proteins) 의 변화를 유발할 가능성이 있습니다.


Advanced Analysis
유의미한 변이율을 보이는 유전자(Significantly Mutated Genes, SMGs)는 배경 변이율(Background Mutation Rate, BMR)보다 높은 변이율을 가지며, 이는 종양 발생 과정에서 양성 선택(positive selection)을 받았음을 시사합니다.
SMG 분석 (SMG analysis) 을 통해 암 발생 (cancer initiation) 및 진행 (cancer progression) 에 중요한 핵심 유전자를 식별할 수 있습니다.

참고: 상단의 바 그래프 (bar plot) 는 각 샘플의 변이율 (Mutations/Mb) 을 나타냅니다. 중앙의 히트맵 (heatmap)은 샘플별 각 SMG (Significantly Mutated Gene)의 변이 유형(mutation types)**을 보여줍니다.
가로축 (x-axis): 샘플 (samples)
세로축 (y-axis): 유의하게 변이된 유전자 (SMGs)
서로 다른 변이 유형 (mutation types) 은 각기 다른 색상으로 구분됩니다.
히트맵의 왼쪽 바 그래프는 각 SMG에서 변이가 발생한 샘플의 비율 (percentage of affected samples) 을 나타내며, 오른쪽 바 그래프는 SMG의 p-value를 보여줍니다.
Tumor Heterogeneity Analysis
종양 내 이질성과 클론 구조 (clonal architecture) 를 해독 (deciphering) 하는 것은 치료 저항성(therapeutic resistance) 을 이해하는 데 기여할 수 있습니다.
종양 아형의 개수와 구성(하위 클론 체세포 변이)은 체세포 변이의 변이 대립 유전자 빈도(variant allele frequency) 분석을 통해 확인되었습니다.

참고: 각 패널의 가로축은 변이 대립 유전자 빈도(VAF, Variant Allele Frequency)를 나타냅니다. VAF가 상대적으로 낮은 변이 클러스터는 하위 클론 집단(subclonal population)을 의미합니다.
맨 위 패널은 복제수(copy number)가 1, 2, 또는 3인 영역에서의 VAF 커널 밀도(kernel density)를 보여줍니다. 또한, 복제수 중립(copy number neutral) 변이에 대한 모든 클러스터의 후방 예측 밀도(posterior predictive density)와 각 클러스터/구성 요소별 후방 밀도(posterior density)를 나타냅니다.
아래 패널들은 각 복제수 영역에서의 리드 깊이(read depth)와 VAF 간의 관계를 시각적으로 표현합니다.
인간 전장 유전체 시퀀싱